
Global Capital: Weight, Control and Direction
How much it is worth, where it is concentrated, through which infrastructures it moves, and which signals deserve attention.
Three Numbers. Three Different Things.
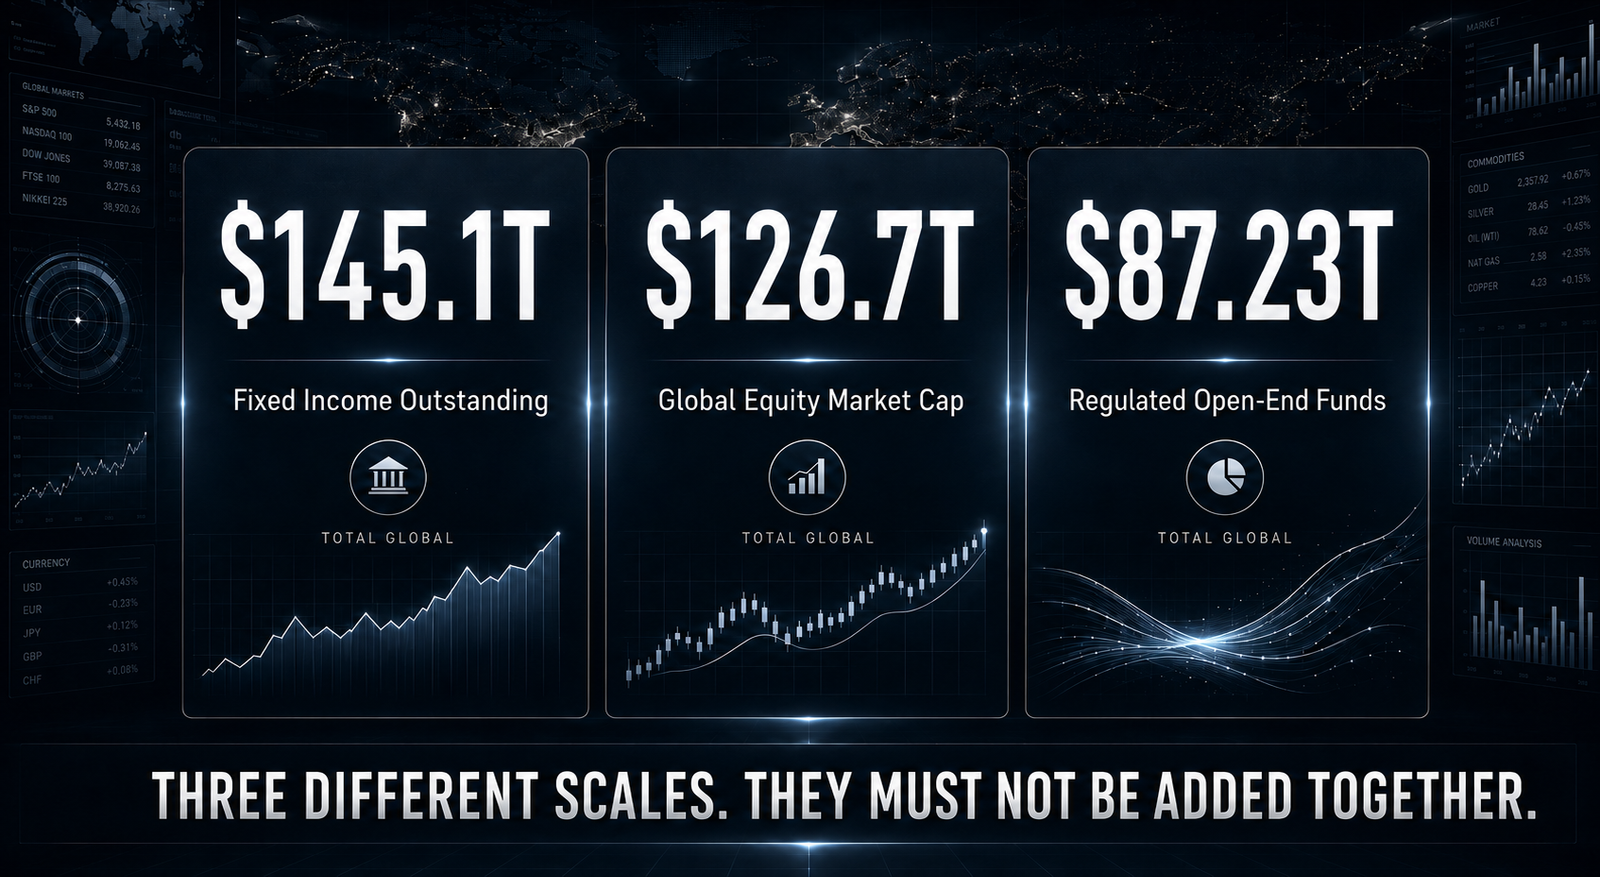
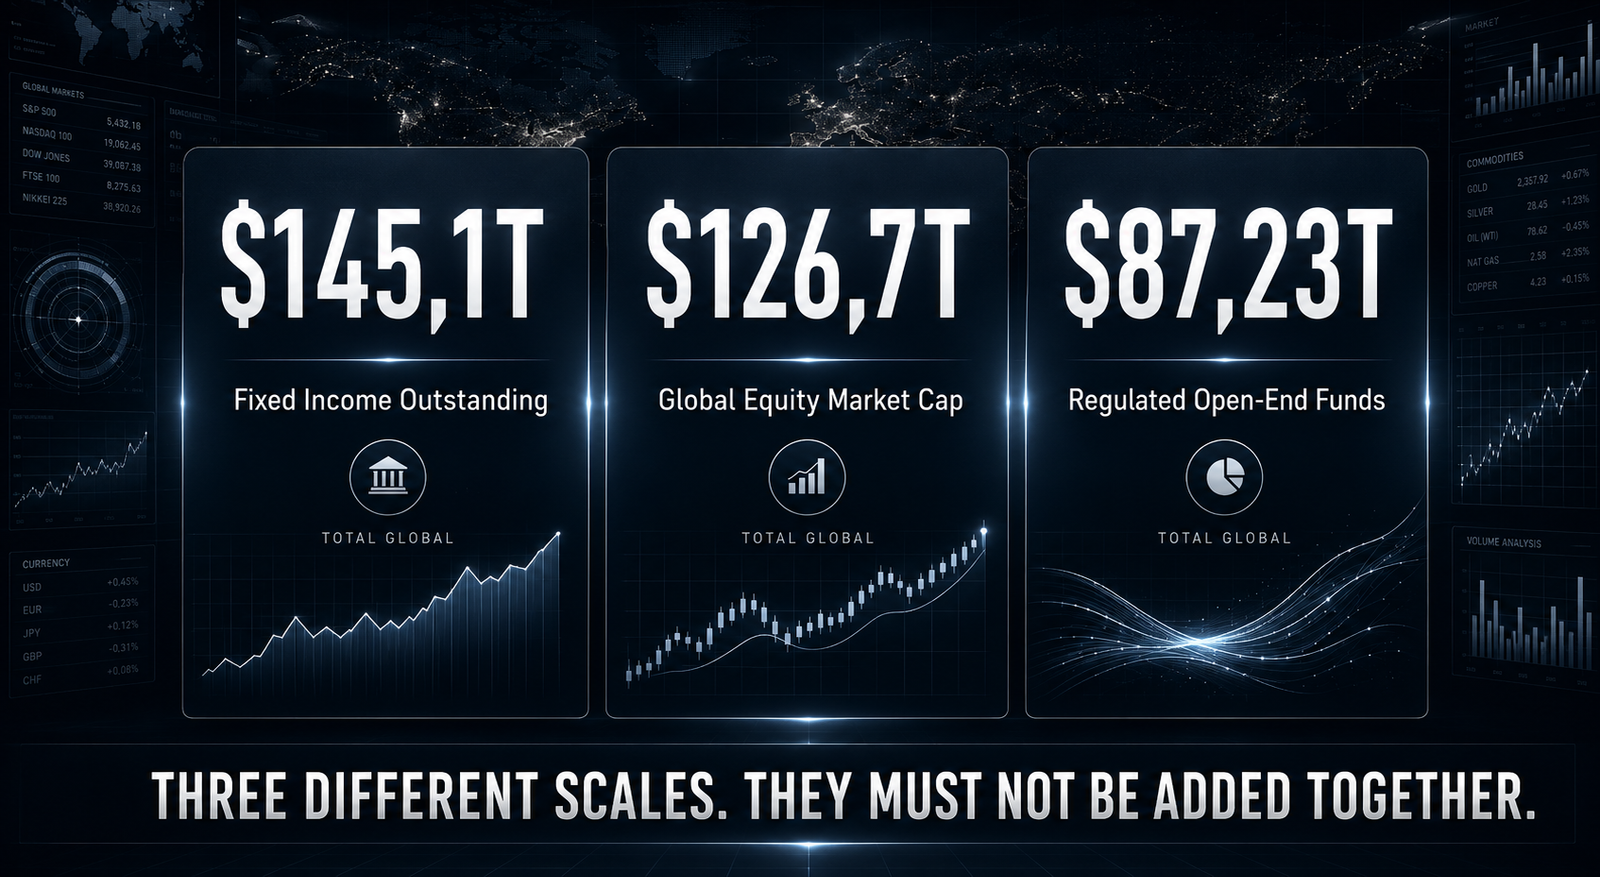
The size of global finance changes depending on what we are measuring: outstanding debt securities, the market value of listed companies, or the assets of regulated funds. These are large figures that partially overlap.
More specifically, we refer to Fixed Income Outstanding, Global Equity Market Capitalization and the assets of Regulated Open-End Funds.
They are not components of a single total and must not be added together: they measure different, partially overlapping parts of the global financial system.
The Dollar Carries Weight in Two Different Ways
The weight of the dollar changes radically depending on the metric observed: one measure is how much is held in official reserves, while another is how deeply it is embedded in the daily functioning of the global foreign exchange market.
<span style="font-size:34px; line-height:1; font-weight:700;">56,77%</span>
Dollar in official reserves
<span style="font-size:34px; line-height:1; font-weight:700;">89,2%</span>
Dollar in FX transactions
Atlas Interpretation
Holdings and infrastructure are not the same thing.
Four Hubs Account for 75% of Global FX Trading
In 2025, just four hubs — the United Kingdom, the United States, Singapore and Hong Kong SAR — accounted for approximately 75% of global foreign exchange market activity.
The Two Dominant Hubs
38% — United Kingdom
The world’s leading centre for FX trading.
19% — United States
The second-largest global hub.
Combined: approximately 57% of the market.
Asia’s Growing Hubs
11.8% — Singapore
The world’s third-largest FX trading hub.
7.0% — Hong Kong SAR
The fourth-largest global hub.
Combined: approximately 19% of the market.
Flows Are Changing the Relative Balance
In Q1 2026, global regulated open-end funds recorded net inflows of $931 billion. The composition of these flows shows where capital increased its relative weight.
+$931 billion
<span style="font-size:30px; line-height:1.1;">+$385 billion</span><br><span style="font-size:18px; line-height:1.3;">Bond Funds</span>
<span style="font-size:30px; line-height:1.1;">+$196 billion</span><br><span style="font-size:18px; line-height:1.3;">Equity Funds</span>
Where Fund Capital Is Located
At the end of Q1 2026, the global assets of regulated open-end funds showed a strongly asymmetric distribution, both by product type and by geography.
By Fund Type
48% — Equity Funds
Funds primarily invested in equities.
19% — Bond Funds
Funds primarily invested in debt securities.
15% — Money Market Funds
Funds focused on money market and very short-term instruments.
By Geography
57% — Americas
The dominant share of global assets.
31% — Europe
The second-largest global region.
12% — Africa + Asia-Pacific
The combined share of the two macro-regions.
Signal Board — Three Signals to Track
Not forecasts, but three movements already visible in the data: shifts in relative weight, differences between holdings and infrastructure, and the concentration of financial hubs.
Signals to monitor over time by comparing their persistence, geography and underlying causes.
Where Market Anomalies Begin
Anomalies emerge when weights, flows, accessibility and concentration stop moving in balance. It is within these divergences that signals, imbalances and potential niches begin to appear.
Four Variables to Cross-Reference
Capital Weight
Where assets are concentrated.
Flow Velocity
Where capital is increasing or reducing its exposure.
Accessibility
How easy it is for the public to enter that market or access that product.
Where to Look for Niches
High capital + low access
Assets are present, but instruments or operators remain difficult to access.
Growing flows + concentrated supply
Demand is increasing faster than distribution capacity.
Developed market + underpenetrated product
The country has capital and infrastructure, but one category remains underdeveloped.
High costs + weak competition
From Data to Direction
From numbers to relationships. From relationships to direction.
An isolated data point describes. The intersection of weights, flows, geography, accessibility, costs and concentration indicates where to look.
Global Financial Atlas does not use a single number to draw conclusions. It compares different magnitudes, verifies persistence and context, and identifies divergences between markets, countries and products.
It is from these divergences that signals, imbalances and potential niches emerge.
A number describes the market. Cross-referencing numbers reveals where to look.
globalfinancialatlas is proudly powered by WordPress